Mean, median, correlation, t-test, chi-square, ANOVA, regression — with so many statistical tools covered across this site, the hardest part is often simply knowing which one actually fits your question. This guide is a practical decision framework: a small number of questions that, answered honestly about your own data, point directly to the right tool.
- The three questions that narrow down which test or method applies
- A complete decision map covering every method on this site
- Worked examples matching real research questions to the right test
- What to do when more than one method seems to fit
Question 1: What Kind of Outcome Are You Measuring?
This framework ties together every method covered across this site — think of it as the map that turns "I have some data and a question" into a specific, correctly-chosen tool from among everything covered elsewhere here, rather than a guess.
Start with your outcome variable — see types of data for the full distinction. Is it numeric (a continuous or count measurement, like height, test score, or time), or categorical (a label or category, like pass/fail, product preference, or a satisfaction rating)?
Question 2: How Many Groups or Variables Are Involved?
Are you describing a single group, comparing two groups, comparing three or more groups, or examining the relationship between two continuous variables?
Question 3: Are You Describing Data You Have, or Inferring About a Wider Population?
Descriptive statistics (mean, median, standard deviation, percentiles) summarize the data in front of you. Inferential methods (confidence intervals, hypothesis tests) use a sample to draw a conclusion about a broader population the sample represents. Nearly all confusion about "which test" traces back to skipping this question — the same underlying data can call for entirely different tools depending on which of these two jobs you're actually trying to do.
The Decision Map
Describing a single numeric variable: mean, median, mode; standard deviation; percentiles and quartiles; skewness and kurtosis for shape.
Estimating a population parameter from a sample: confidence interval for a mean or proportion; use sample size planning beforehand.
Comparing a sample mean to a known/hypothesized value: one-sample t-test.
Comparing two independent numeric groups: independent two-sample t-test.
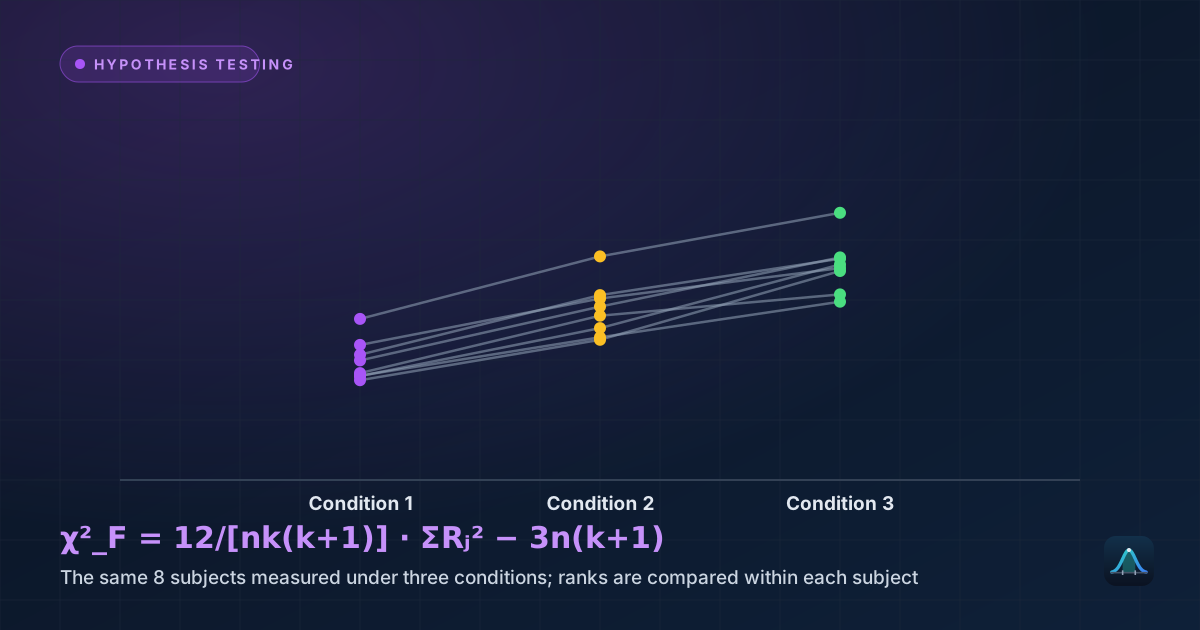
Comparing two numeric measurements on the SAME subjects (before/after): paired t-test.
Comparing three or more numeric group means: one-way ANOVA, followed by a post-hoc test if significant.
Testing whether one categorical variable's frequencies match an expectation: chi-square goodness-of-fit test.
Testing whether two categorical variables are related: chi-square test of independence.
Measuring the strength of a linear relationship between two numeric variables: Pearson correlation.
Predicting a numeric outcome from one or more numeric/categorical predictors: simple or multiple linear regression.
Predicting a binary (yes/no) outcome from one or more predictors: logistic regression.
Modelling counts of rare events over an interval: Poisson distribution.
Modelling counts of successes across a fixed number of independent trials: binomial distribution.
"Does a new drug lower blood pressure more than a placebo?" → numeric outcome (blood pressure), two independent groups → independent two-sample t-test. "Is customer satisfaction related to store location?" → both variables categorical → chi-square test of independence. "Can I predict house price from square footage and location?" → numeric outcome, multiple predictors → multiple linear regression. "Did the new checkout flow increase conversion rate?" → binary/proportion outcome, two groups → two-proportion test, exactly the logic behind A/B testing.
What If More Than One Method Seems to Fit?
This happens more often than textbooks suggest, and it's usually a sign the research question itself needs sharpening, not that the statistics are ambiguous. "Is there a difference between these groups" could mean a difference in means (t-test/ANOVA), a difference in variability (a test for equal variances), or a difference in the full shape of the distribution (a non-parametric test like Mann-Whitney U) — these are genuinely different questions with the same everyday phrasing, and clarifying exactly what "difference" means is usually the real next step, not picking a test at random from several that all seem plausible.
When Assumptions Aren't Met: Non-Parametric Alternatives
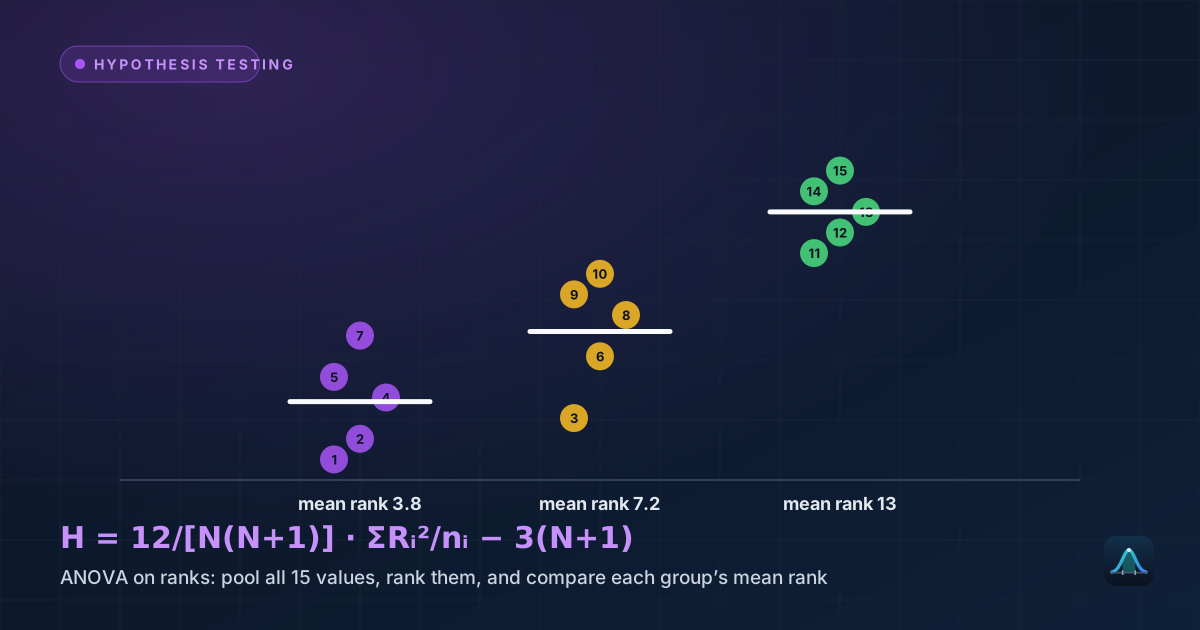
Every method above carries assumptions (often approximate normality, as covered throughout this site). When those assumptions are seriously violated — heavily skewed data, small samples with visible non-normality, ordinal rather than genuinely continuous data — non-parametric alternatives exist for most of the standard tests: Mann-Whitney U in place of an independent t-test, Wilcoxon signed-rank in place of a paired t-test, and Kruskal-Wallis in place of one-way ANOVA (mentioned in that article). These trade some statistical power for methods that don't depend on the same distributional assumptions, and are worth reaching for deliberately when a genuine assumption violation is present, not as an automatic default.
More Worked Triage Examples
"What's the average commute time in my city?" → describing a single numeric variable, no comparison → mean and median (paired with standard deviation for spread), not a formal test at all.
"Based on a survey of 500 residents, what's the true average commute time across the whole city?" → same variable, but now inferring a population value from a sample → confidence interval for a mean.
"Do three different fertilizers produce different average crop yields?" → numeric outcome, three groups → one-way ANOVA.
"Is exam score related to hours studied?" → two numeric variables, relationship question → Pearson correlation (strength/direction) and/or simple linear regression (if you also want to predict scores from study hours).
"Does a customer's age predict whether they'll buy a premium subscription?" → binary outcome, numeric predictor → logistic regression.
Common Mistakes in Test Selection
Picking a test based on familiarity rather than fit. Defaulting to a t-test for every two-group comparison, even when the outcome is actually categorical (which calls for chi-square instead), is a common pattern — usually because the t-test is the most memorable tool, not because it genuinely fits every situation.
Treating "correlation" and "regression" as interchangeable. As covered in the Pearson correlation and simple linear regression articles, these answer related but distinct questions — strength/direction of a relationship versus a predictive equation — and the right choice depends on which of those two things you actually need.
Ignoring the paired-vs-independent distinction when comparing two groups. This specific error is flagged repeatedly throughout this site's t-test coverage because it's genuinely common and produces a wrong, not just suboptimal, result when the two measurements actually come from the same subjects.
Choosing a test after seeing the data's results rather than before. Deciding which test to run based on which one happens to produce a significant result — rather than choosing the appropriate test based on the research question and data structure before looking at outcomes — is a form of p-hacking, covered in the hypothesis testing framework article, and undermines the validity of the resulting p-value.
What if I have both numeric and categorical predictors for the same outcome?
Is there ever a "wrong" test that still gives a plausible-looking answer?
Should I always start with a formal test, or with exploratory analysis?
Share this article
Written by
Statistics Fundamentals Editorial Team
Written and reviewed by our team of statistics educators. Content is aligned with GCSE, A-Level, AP Statistics, and undergraduate curricula.
About Statistics Fundamentals →