Ask ten people what "average" means and most will describe the mean — add everything up, divide by how many values there are. That's correct, but incomplete. Statistics gives you three distinct measures of "the middle" — mean, median, and mode — and which one actually represents your data well depends entirely on what the data looks like.
Pick the wrong one and you can tell a misleading story without ever stating a false number. This isn't a hypothetical: reported "average" salaries, house prices, and commute times are routinely one of these three measures chosen — sometimes carelessly, sometimes deliberately — because it tells a more flattering story than the others would.
- How mean, median, and mode are actually calculated — and where each one breaks down
- Why the median resists outliers and the mean doesn't
- How to read the gap between mean and median as a signal of skew
- When mode is the only sensible option — and when it tells you nothing
- How to handle grouped data and weighted averages, not just raw lists of numbers
The Mean: Every Value Has a Vote
The mean (formally, the arithmetic mean) is the sum of all values divided by the count of values:
Every single value in the data set contributes to the mean, proportionally to its size. This is exactly why the mean is so useful — it genuinely reflects the entire data set — and exactly why it's fragile: one enormous or tiny value can drag it a long way from where "most" of the data actually sits.
Consider five houses on a street, valued at $200k, $210k, $220k, $230k, and $2.4 million (a mansion someone built on a corner lot). The mean house value is $652k — a number that doesn't describe a single house on the street. Four of the five houses are nowhere near it.
The Median: The Value in the Middle
The median is the middle value when the data is sorted from smallest to largest. With an odd number of values, it's the single middle one. With an even number, it's the average of the two middle values.
For the same five houses — sorted: 200k, 210k, 220k, 230k, 2,400k — the median is $220k. That's a far more honest description of what a typical house on that street costs, because the median only cares about position in the sorted order, not the magnitude of any single value. The mansion could be worth $2.4 million or $24 million and the median wouldn't move at all.
This is precisely why household income, house prices, and commute times are reported as medians in almost every serious news article and government statistic. These distributions are routinely stretched by a small number of very high values, and the mean would systematically overstate what a "typical" case looks like.
The Mode: What Occurs Most Often
The mode is the value (or values) that occur most frequently in a data set. Unlike mean and median, it's the only central-tendency measure that makes sense for categorical, non-numeric data — you can find the mode of a list of favourite ice-cream flavours, but you can't meaningfully average them.
A data set can have no mode at all (every value appears exactly once — genuinely common with continuous measurements like precise height or weight), a single mode (unimodal), or several tied modes (bimodal or multimodal). A bimodal distribution — two distinct peaks — is often a sign that two different underlying groups have been mixed together in one data set, and it's usually worth investigating rather than just reporting the two numbers and moving on. A customer satisfaction survey scored 1-10 that comes back strongly bimodal, with peaks near 2 and near 9, is telling you something a single "average" score of 5.5 would completely hide: you likely have two very different groups of customers, not one moderately satisfied group.
Worked Example: All Three, Side by Side
Problem: A small team's weekly overtime hours: 2, 3, 3, 4, 4, 4, 5, 25. (The 25 is one employee who covered an entire colleague's shift during a one-off emergency.)
Mean: (2+3+3+4+4+4+5+25) / 8 = 50 / 8 = 6.25 hours
Median: sorted data is already sorted; middle two values are the 4th and 5th (4 and 4) → (4+4)/2 = 4 hours
Mode: 4 appears three times, more than any other value → 4 hours
Here, median and mode agree (4 hours) and both represent the team's typical week far better than the mean (6.25), which is inflated by a single unusual event. If a manager reported "average overtime is 6.25 hours" without context, it would misrepresent every team member except the one who covered the emergency shift.
Weighted Mean: When Not Every Value Counts Equally
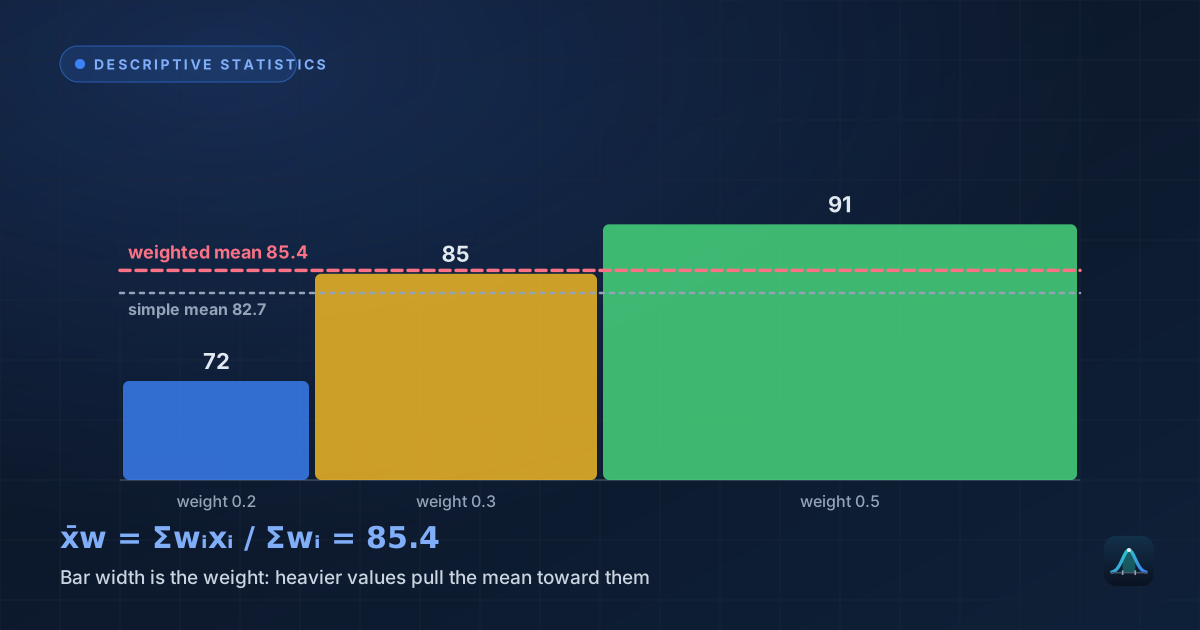
The ordinary mean silently assumes every value deserves equal weight. That assumption breaks down often — a course final grade built from a 20% midterm and an 80% final exam isn't a simple average of the two scores. The weighted mean handles this correctly:
For a student scoring 70 on the midterm and 90 on the final, with weights 0.2 and 0.8: x̄w = (0.2×70 + 0.8×90) / (0.2+0.8) = (14+72)/1 = 86 — noticeably different from the unweighted average of 80, and correctly reflecting that the final exam counted for far more of the grade.
Central Tendency from Grouped or Frequency Data
Real-world data often arrives already summarized into a frequency table — "12 students scored in the 80-89 range, 8 scored 90-99," and so on — rather than as a raw list of individual values. In that case, the mean is estimated using each group's midpoint multiplied by its frequency: x̄ ≈ Σ(fᵢ·mᵢ) / Σfᵢ, where mᵢ is the midpoint of group i and fᵢ is its frequency. This is an estimate, not an exact value, because the individual values within each group are unknown — but it's the standard, accepted method when only grouped data is available, and it converges to the true mean as group widths shrink.
Reading Skew from the Gap Between Mean and Median
Comparing mean and median costs nothing extra once you've calculated both, and it tells you something valuable about the shape of your data:
- Mean ≈ median — the data is roughly symmetric.
- Mean > median — the data is right-skewed (a long tail of unusually high values pulls the mean up). Income, house prices, and hospital bills typically look like this.
- Mean < median — the data is left-skewed (a long tail of unusually low values pulls the mean down). Age at retirement in a workforce with a hard minimum retirement age often looks like this.
This single comparison is often the fastest sanity check you can run on a new data set, before you've even plotted a histogram. For a deeper, more precise measure of asymmetry, see our guide to skewness and kurtosis.
Which One Should You Actually Report?
There's no universal rule, but a workable default: report the median as your headline "typical value" whenever you suspect outliers or skew, and pair it with the mean so the reader can see the gap for themselves. Use the mode only for categorical data, or when you specifically care about "what's most common" rather than "what's typical" — these are different questions. A shoe retailer cares about the modal shoe size sold (to stock correctly), not the mean shoe size (which might not correspond to any real shoe).
A middle-ground option worth knowing exists: the trimmed mean, which discards a fixed percentage of the highest and lowest values (commonly 5% or 10% from each end) before averaging the rest. This keeps most of the mean's mathematical convenience while reducing its sensitivity to a small number of extreme outliers — it's the method used to score Olympic diving and gymnastics, where the highest and lowest judge scores are dropped before the remainder are averaged.
"Average" is not a technical term — it's a catch-all word that in everyday use almost always means the mean specifically, but in careful statistical writing it should be avoided in favour of naming exactly which measure (mean, median, or mode) you're using. When you read a news headline citing "the average," it's always worth asking which one, and why that one was chosen.
Can the mean, median, and mode all be the same value?
Is the median always exactly one of the original data values?
What should I do if my data has no mode?
Why do statisticians prefer the mean for further calculations even though the median resists outliers?
What is a weighted mean used for in practice?
Share this article
Written by
Statistics Fundamentals Editorial Team
Written and reviewed by our team of statistics educators. Content is aligned with GCSE, A-Level, AP Statistics, and undergraduate curricula.
About Statistics Fundamentals →