Surveys and tests rarely measure a trait with a single question. A job-satisfaction scale might use five statements, an anxiety inventory twenty, a maths test forty problems. Adding the answers into one score only makes sense if the items all tap the same underlying trait. Cronbach's alpha is the most widely reported measure of this internal consistency: it summarizes how strongly the items of a scale move together, and therefore how much of the total score's variability reflects a shared trait rather than item-specific noise.
- The formula for alpha and the idea behind it
- A complete worked example with six respondents and four items
- How to find an item that does not belong
- How to interpret alpha, and what it cannot tell you
The Idea and the Formula
Each respondent's total score is the sum of their item scores. The variance of a sum equals the sum of the item variances plus twice every pairwise covariance, as shown in covariance. If items are unrelated, the covariances vanish and the total variance is just the sum of the item variances. If items go up and down together, the covariances are large and positive, and the total variance far exceeds the sum of the item variances. Alpha measures that excess. For k items:
The ratio inside the brackets is the share of total variance accounted for by the items separately. The rest, one minus that ratio, comes from the items co-varying. The leading k ÷ (k − 1) rescales the result so that a perfectly consistent scale gives exactly 1.
Worked Example
Problem: Six people rate four statements about their workplace on a 1 to 5 agreement scale. Compute alpha.
| Respondent | Item 1 | Item 2 | Item 3 | Item 4 | Total |
|---|---|---|---|---|---|
| 1 | 4 | 5 | 4 | 3 | 16 |
| 2 | 3 | 3 | 4 | 4 | 14 |
| 3 | 5 | 5 | 5 | 3 | 18 |
| 4 | 2 | 3 | 2 | 4 | 11 |
| 5 | 4 | 4 | 3 | 2 | 13 |
| 6 | 1 | 2 | 2 | 3 | 8 |
Step 1 — Item variances (sample variance, dividing by n − 1 = 5). Item 1 has mean 3.167 and variance 10.833 ÷ 5 = 2.167. Items 2 and 3 each have variance 1.467, and Item 4 has variance 2.833 ÷ 5 = 0.567. The sum is 2.167 + 1.467 + 1.467 + 0.567 = 5.667.
Step 2 — Variance of the totals. The totals 16, 14, 18, 11, 13, 8 have mean 13.333 and a sum of squared deviations of 63.333, giving a variance of 63.333 ÷ 5 = 12.667.
Step 3 — Alpha.
The total variance (12.67) is more than double the sum of the item variances (5.67), evidence that the items share a lot of common variation. Alpha of about 0.74 falls in the range usually described as acceptable.
Finding an Item That Does Not Belong
Statistical software also reports alpha with each item deleted in turn, and each item's correlation with the total of the other items. For these data:
| Item | Correlation with sum of the others | Alpha if item deleted |
|---|---|---|
| 1 | 0.84 | 0.44 |
| 2 | 0.81 | 0.49 |
| 3 | 0.88 | 0.45 |
| 4 | −0.30 | 0.94 |
Items 1 to 3 hang together strongly: dropping any of them would cut alpha sharply, from 0.74 to the mid-0.40s. Item 4 behaves differently. It correlates negatively with the rest, and removing it raises alpha to about 0.94. Look at its scores: respondent 3, who rated everything else a 5, gave Item 4 only a 3, while respondent 4, who rated the others at 2 to 3, gave it a 4. A pattern like this often signals a reverse-worded question that was not recoded, a confusing statement, or an item measuring something different. The right response is to inspect the wording and decide, not to delete the item automatically. Note also that six respondents is far too few for real work; the example is sized for hand calculation, and applied scale development normally uses dozens to hundreds of respondents.
Alpha and Correlations
Alpha rises with two things: the average correlation between items, and the number of items. A closely related standardized form is k × r̄ ÷ [1 + (k − 1) × r̄], where r̄ is the mean inter-item correlation. For instance, four items with an average correlation of 0.4 give alpha = (4 × 0.4) ÷ (1 + 3 × 0.4) = 1.6 ÷ 2.2 ≈ 0.73, while ten items with that same average correlation give 4 ÷ 4.6 ≈ 0.87. Longer scales therefore earn higher alphas even when items are only moderately related, which is one reason a high alpha should not be taken at face value.
Interpreting the Value
A frequently cited convention treats 0.70 as acceptable, 0.80 as good, and 0.90 or more as excellent, though the appropriate level depends on the purpose. Group-level comparisons tolerate lower reliability than decisions about individuals. A very high value, above about 0.95, can even indicate redundancy, with items that ask nearly the same question in slightly different words. These are guidelines rather than laws, and alpha should be reported with a confidence interval where sample size permits, since it is an estimate like any other (see confidence intervals).
What Alpha Does Not Tell You
- It does not prove the scale is unidimensional. A scale mixing two correlated but distinct traits can still produce a high alpha. Factor analysis is the tool for examining structure.
- It does not show validity. A scale can be consistently measuring the wrong thing. Reliability is necessary but not sufficient for validity.
- It assumes items contribute about equally. When items differ greatly in how strongly they relate to the trait, alpha understates reliability.
- It is not stable across populations. Alpha depends on the sample; the same scale can look more reliable in a varied group than in a homogeneous one.
Real-World Uses
Psychology and education research: reporting the reliability of questionnaires and tests, particularly those built from Likert-type items like those described in types of data.
Market research: verifying that a set of attitude statements can be combined into a single satisfaction or brand-perception score.
Health measurement: assessing patient-reported outcome instruments before using their total scores in analyses.
Common Mistakes
Forgetting to reverse-code negatively worded items. Uncorrected reverse items lower alpha sharply, and can even produce a negative value, as Item 4 hints at above.
Treating alpha as a property of the scale alone. It belongs to the scale and the sample. Report it for your own data instead of quoting a value from a previous study.
Chasing a higher alpha by adding near-duplicate items. This inflates the number without improving measurement.
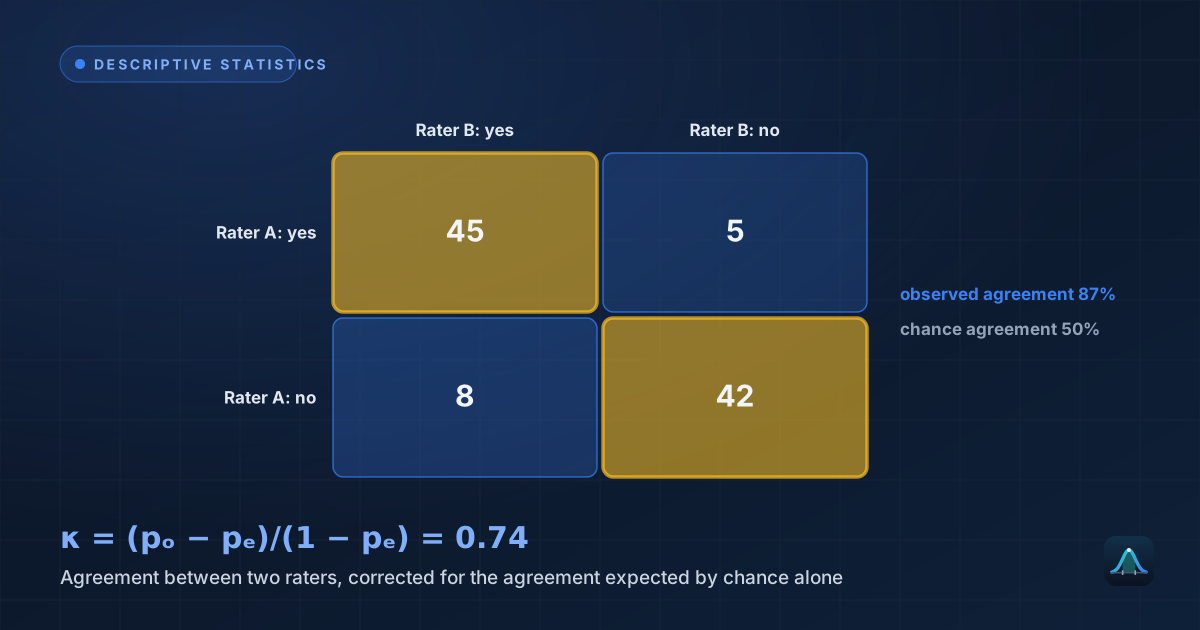
Confusing consistency with agreement. Alpha describes how items of a scale move together within respondents, not how much two raters agree, which is measured by Cohen's kappa.
What is a good Cronbach's alpha?
Can alpha be negative?
Does a high alpha mean the scale measures one thing?
How many respondents do I need?
Share this article
Written by
Statistics Fundamentals Editorial Team
Written and reviewed by our team of statistics educators. Content is aligned with GCSE, A-Level, AP Statistics, and undergraduate curricula.
About Statistics Fundamentals →