Every regression example on this site so far has used numeric predictors — temperature, hours studied, years of experience. Plenty of real predictors are categorical instead: department, region, treatment group, product type. A dummy variable is the standard technique for bringing a categorical predictor into a regression model, by recoding each category as a column of 0s and 1s, letting the same least-squares machinery used throughout this site's regression articles handle categorical information just as naturally as numeric information.
- How a categorical variable is converted into dummy variables
- A full worked example predicting salary from experience and department
- Why one category is always left out as the baseline
- How to code a category with more than two levels
How Dummy Coding Works
For a categorical variable with two levels — say, Department: Sales or Engineering — a single dummy variable is created, coded 1 for one category and 0 for the other. The category coded 0 becomes the implicit baseline (or reference category) that the other category's effect is measured against. This 0/1 column can then be added directly into a regression model exactly like any numeric predictor.
Worked Example
Problem: A company models employee salary from years of experience and department (Sales or Engineering). Sales is coded as the baseline (D_eng=0); Engineering is coded D_eng=1. The fitted model is:
Find the predicted salary for a Sales employee with 5 years of experience, and for an Engineering employee with the same 5 years of experience.
Sales employee (D_eng=0): Salary = 40,000 + 2,000(5) + 8,000(0) = 40,000 + 10,000 + 0 = $50,000
Engineering employee (D_eng=1): Salary = 40,000 + 2,000(5) + 8,000(1) = 40,000 + 10,000 + 8,000 = $58,000
At the identical experience level, the Engineering employee's predicted salary is exactly $8,000 higher than the Sales employee's — precisely the dummy variable's own coefficient. This is exactly what a dummy coefficient represents: the average difference in the outcome between that category and the baseline category, holding every other predictor in the model constant.
Interpreting the Model Geometrically
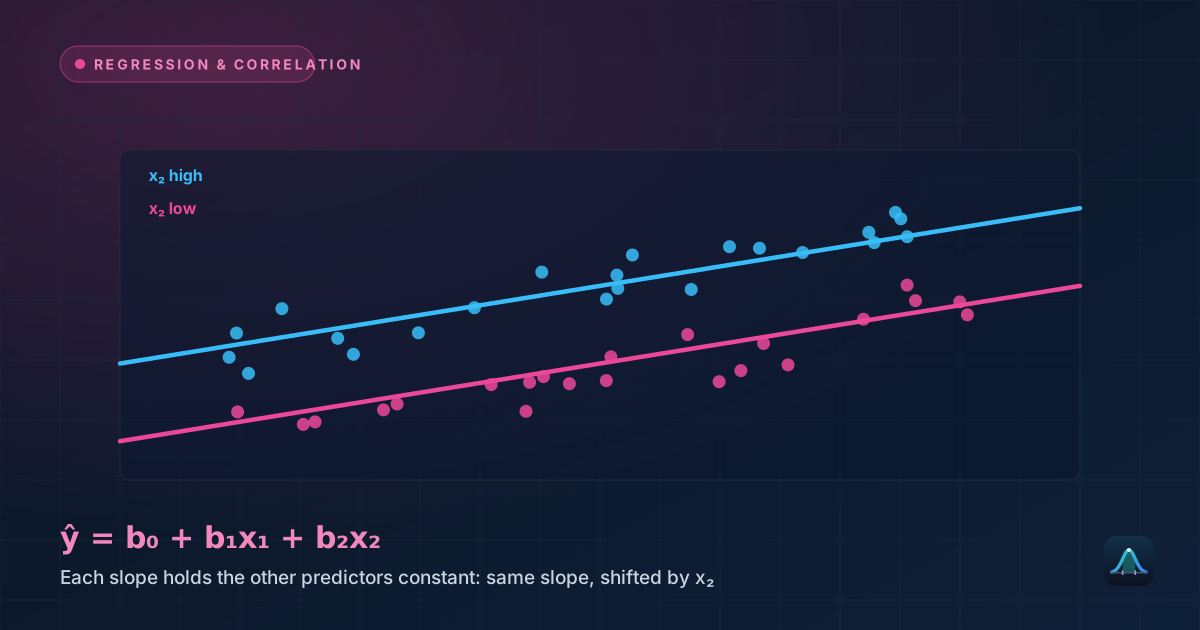
With one numeric predictor and one dummy variable, the fitted model produces two parallel lines — one for each department — both with the identical slope (2,000 per year of experience) but different intercepts (40,000 for Sales, 48,000 for Engineering, since 40,000+8,000=48,000 is Engineering's effective starting point at zero years of experience). The dummy variable shifts the whole line up or down by a fixed amount; it doesn't change the relationship between experience and salary within each department, unless an interaction term is added specifically to allow the slopes themselves to differ between categories — for example, if Engineering salaries grew faster per year of experience than Sales salaries do, an interaction term between D_eng and Experience would be needed to capture that, since the plain dummy variable alone can only shift the line's height, not its steepness.
Why One Category Is Always Left Out
A categorical variable with k categories needs only k−1 dummy variables, never k. Including a dummy for every single category, plus the model's intercept, would create perfect multicollinearity — the omitted-category information becomes entirely redundant once all the others are known, since a case not coded 1 in any other dummy must belong to the one category left out. This is exactly why Sales, in the worked example, never gets its own explicit dummy column: it's fully represented by D_eng being 0.
Coding a Category With More Than Two Levels
For a categorical variable with more than two levels — say, Region: North, South, East, West — one category is chosen as the baseline (say, North), and a separate dummy variable is created for each of the remaining categories (South, East, West), each coded 1 for that specific region and 0 for every other row, including the baseline. A variable with k=4 categories therefore needs exactly k−1=3 dummy variables, and each dummy's coefficient represents that specific region's average difference from the North baseline, holding other predictors constant — following the same logic as the two-category case, just with more comparison columns.
Real-World Uses
Comparing treatment groups in an experiment: whenever an experiment has more than two treatment arms (a control plus two different drug doses, for example), dummy variables are the standard way to include treatment assignment as a predictor in a regression model, with the control group typically chosen as the natural baseline.
Controlling for categorical confounders: including region, industry, or time period as dummy variables alongside a variable of real interest lets a regression model account for average differences across those categories, isolating the relationship of actual interest more cleanly — directly related to the logic behind partial correlation's goal of removing a third variable's influence.
Seasonal or time-period effects: including month or day-of-week as dummy variables in a regression model is a standard way to account for recurring seasonal patterns, complementing the more general seasonality concepts covered in time series basics.
Common Mistakes
Including a dummy variable for every category, plus the intercept. This creates the "dummy variable trap" — perfect multicollinearity that makes the model's coefficients impossible to estimate uniquely; always leave exactly one category out as the baseline.
Treating a dummy coefficient as an absolute value rather than a relative comparison. A dummy coefficient is always specifically "relative to the baseline category" — it says nothing about the baseline category's own absolute level directly; that information comes from the model's intercept, not from the dummy coefficient itself.
Choosing a baseline category that makes results awkward to communicate. While the choice never changes the model's actual predictions, picking an unusual or rarely-relevant category as the baseline can make every other coefficient harder for a reader to interpret at a glance — choosing the most common category, or the one most relevant for comparison, is usually the more practical default.
Does the choice of baseline category change the model's actual predictions?
Can a dummy variable's coefficient be tested for statistical significance?
Is dummy coding the same as one-hot encoding?
Can a model have both dummy variables and continuous predictors together?
Share this article
Written by
Statistics Fundamentals Editorial Team
Written and reviewed by our team of statistics educators. Content is aligned with GCSE, A-Level, AP Statistics, and undergraduate curricula.
About Statistics Fundamentals →