R² tells you what proportion of variation a regression model explains — but a high R² alone doesn't confirm that relationship is statistically real rather than a fluke of a small sample. The F-test for overall regression significance answers exactly that question: is the model, as a whole, explaining a genuinely significant amount of variation, or could the observed R² plausibly have arisen by chance alone? It's the regression equivalent of asking whether a correlation, an ANOVA result, or any other summary statistic reflects a real underlying pattern rather than sampling noise.
- The hypotheses being tested, and the F-statistic's formula
- A full worked example, computed on the ice-cream-sales data from simple linear regression
- Why F equals t² in the specific case of simple linear regression
- How this test extends to multiple regression with several predictors
The Hypotheses
For simple linear regression, the overall F-test's hypotheses are:
H₀: β₁ = 0 (the slope is zero — x has no linear relationship with y, and the "model" is really just the flat mean of y)
H₁: β₁ ≠ 0 (the slope is genuinely nonzero — x does have a real linear relationship with y)
This uses the same variance-comparison logic as ANOVA — in fact, the F-test for regression significance and one-way ANOVA are built on the exact same underlying F-statistic machinery, just applied to a regression model's explained-versus-unexplained variance rather than between-group-versus-within-group variance.
The Formula
SSR (regression sum of squares) measures the variation the model explains; SSE (error sum of squares) measures the variation left unexplained. For simple linear regression, df₁ = 1 (one predictor) and df₂ = n−2. A large F value means the model explains substantially more variation than random noise alone would produce.
Worked Example
Problem: Using the ice cream shop data from simple linear regression — temperature predicting daily sales, with n=5 data points and R² ≈ 0.987 — test whether the regression is statistically significant at α=0.05.
From the original data: SST (total sum of squares) = 1,538.0, SSE (error sum of squares) ≈ 20.63, so SSR = SST − SSE ≈ 1,517.37.
With df₁=1 and df₂=n−2=3: MSR = SSR/1 = 1,517.37. MSE = SSE/3 ≈ 6.877.
F = 1,517.37 / 6.877 ≈ 220.64
Comparing this to the F-distribution with (1,3) degrees of freedom gives a p-value of approximately 0.00066 — far below the conventional 0.05 threshold. The regression relationship between temperature and ice cream sales is highly statistically significant; an F this large would be extremely unlikely to occur if temperature genuinely had no real relationship with sales.
Why F Equals t² for Simple Linear Regression
A genuinely useful cross-check: for simple linear regression specifically (exactly one predictor), the overall F-test and the t-test on the slope coefficient (b₁) are mathematically equivalent — the F-statistic equals the square of the t-statistic. For the worked example above, the t-statistic testing whether b₁ differs from zero comes out to t ≈ 14.854, and indeed 14.854² ≈ 220.64, matching the F-statistic computed above exactly. This equivalence only holds for simple regression with one predictor; once a model has more than one predictor, the overall F-test and any single coefficient's individual t-test are answering genuinely different questions (the model as a whole, versus one specific predictor), and they no longer reduce to the same number. Knowing this equivalence is a useful sanity check when working through a simple regression by hand — if the two calculations don't agree, it's a sign an arithmetic error crept in somewhere along the way.
Extending to Multiple Regression
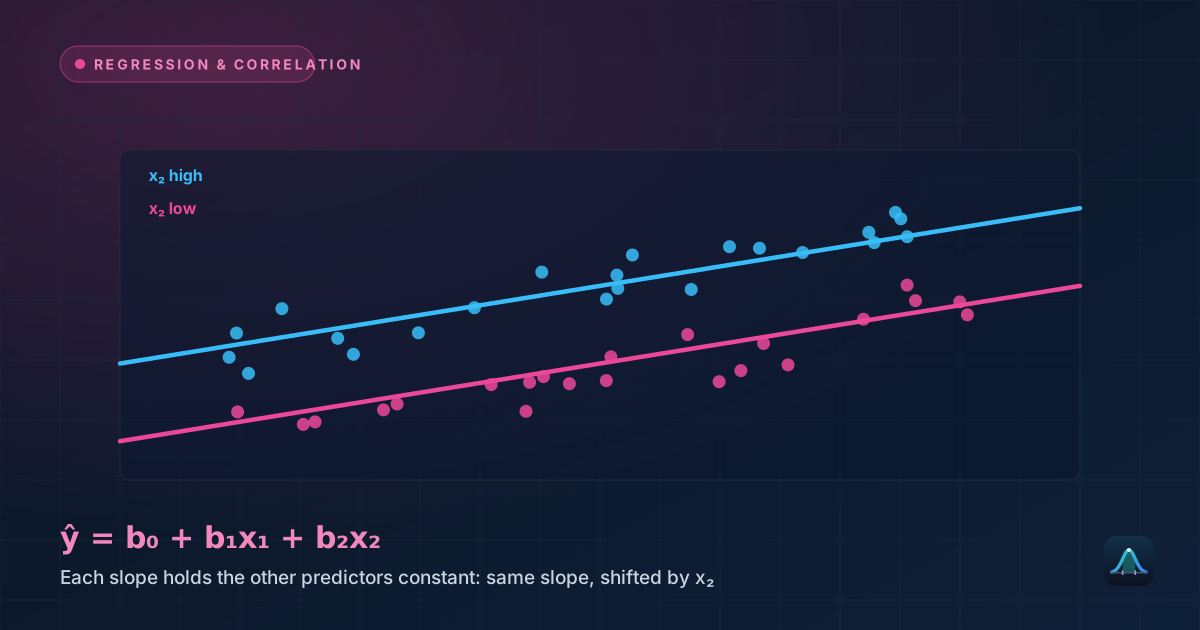
For multiple linear regression with k predictors, the same F-test structure applies, just with df₁ = k instead of 1, testing the joint hypothesis that all slope coefficients are simultaneously zero:
H₀: β₁ = β₂ = ... = βₖ = 0 (none of the predictors, together, explain a significant amount of variation)
This overall test is a necessary first checkpoint before examining individual predictors' own significance — much like a significant one-way ANOVA result only establishes that at least one group differs, without saying which, a significant overall regression F-test only establishes that the model as a whole explains real variation, without saying which specific predictor (or predictors) are responsible. Individual coefficient t-tests are the appropriate next step for that more specific question.
Real-World Uses
Model screening in exploratory analysis: when building a regression model with many candidate predictors, the overall F-test is a standard first checkpoint — a non-significant F-test is a strong signal to reconsider the model's predictors or functional form before investing further effort in interpreting individual coefficients that may not represent anything real.
Reporting alongside R² in published research: academic and applied regression results routinely report the F-statistic, its degrees of freedom, and its p-value alongside R² precisely because R² alone can't distinguish a genuinely significant relationship from one that merely looks impressive due to a small sample — the two numbers together give a fuller, more honest picture.
Comparing nested models: an extended version of the same F-test logic (comparing the change in SSR when additional predictors are added to a model) is used to test whether a more complex model with extra predictors explains significantly more variation than a simpler version — a common step in deciding whether added model complexity is actually justified by the data.
Common Mistakes
Skipping the overall F-test and going straight to individual coefficient t-tests. In a multiple regression model with many predictors, this risks a version of the multiple comparisons problem — checking the overall F-test first is standard, more conservative practice before examining individual predictors.
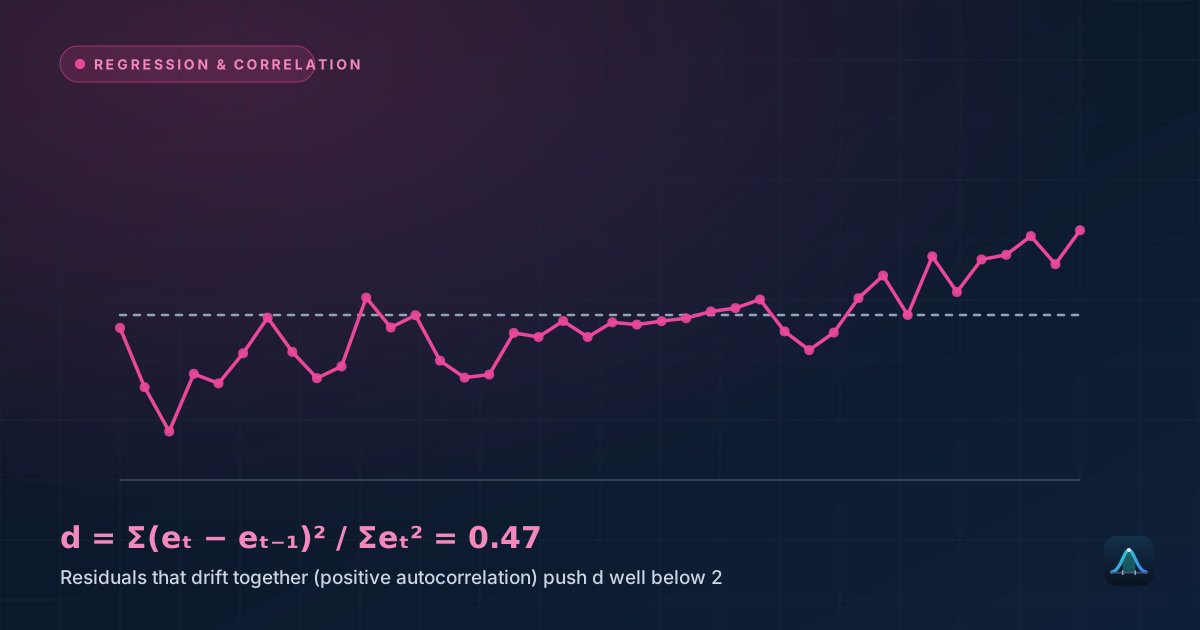
Treating a significant F-test as confirmation the model is well-specified. The F-test only confirms the model explains more variation than chance alone — it says nothing about whether the model's functional form is correct, whether important predictors are missing, or whether the residual diagnostics discussed in simple linear regression look healthy.
Can R² be high but the F-test still not significant?
Is a significant F-test the same as a strong R²?
What happens to the F-statistic as sample size grows, holding R² constant?
Does the F-test tell you which direction the relationship goes?
Share this article
Written by
Statistics Fundamentals Editorial Team
Written and reviewed by our team of statistics educators. Content is aligned with GCSE, A-Level, AP Statistics, and undergraduate curricula.
About Statistics Fundamentals →