A lottery ticket costs $2 and has a tiny chance of winning $1 million. Is it a good bet? Expected value gives a precise, mathematical answer — the long-run average outcome if you played this exact game an enormous number of times. It's one of the most practically useful ideas in probability, directly underlying insurance pricing, investment decisions, and game design.
- The formula for expected value, and what it actually represents
- Why expected value is a long-run average, not a prediction for any single outcome
- How expected value is used to compare decisions under uncertainty
- The difference between expected value and "fair" or "favourable" odds
The Formula
Expected value extends the same weighted-averaging logic behind basic probability into a single summary number for an entire uncertain situation — it's the bridge between a probability distribution and a practical decision.
Multiply each possible outcome by its probability, and sum across every possible outcome. The result is a weighted average — weighted by how likely each outcome is, not a simple average of the raw values.
Worked Example: The Lottery Ticket
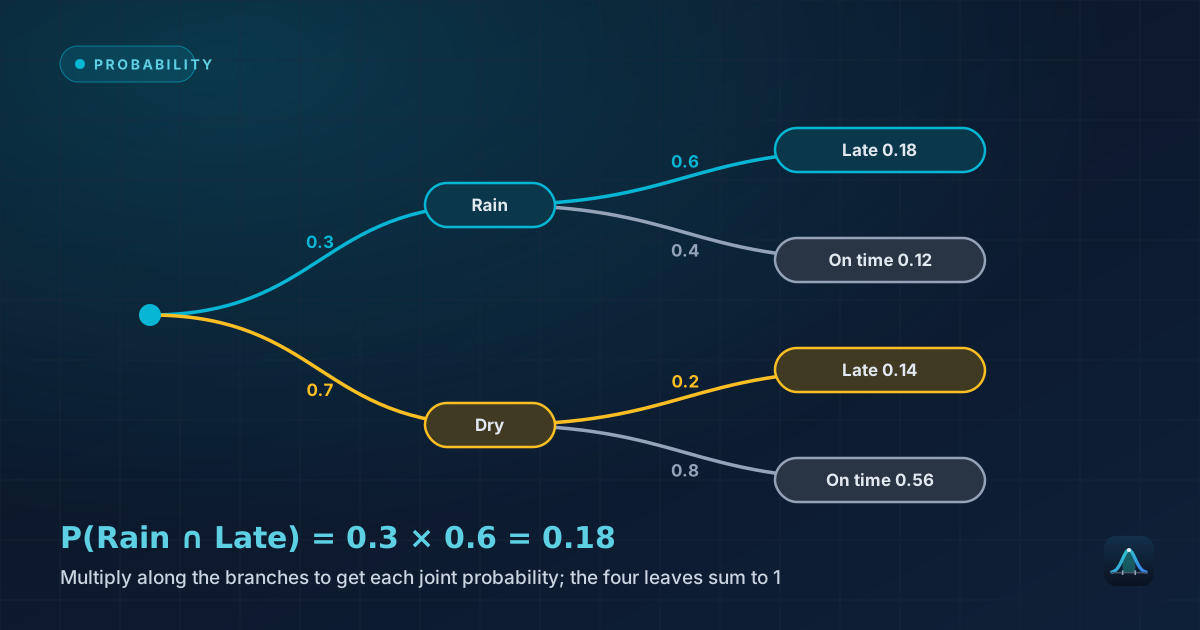
Problem: A raffle sells 1,000 tickets for $2 each. One ticket wins $1,000; all others win nothing. What's the expected value of buying one ticket?
P(win) = 1/1000 = 0.001. P(lose) = 999/1000 = 0.999.
Net outcome if you win: $1,000 − $2 (ticket cost) = +$998. Net outcome if you lose: −$2 (just the ticket cost).
E(X) = (0.001)(998) + (0.999)(−2) = 0.998 − 1.998 = −$1
On average, over many, many raffles like this one, a player loses $1 per ticket. This doesn't mean any individual ticket loses exactly $1 — a single ticket either wins $998 net or loses $2 net, nothing in between. Expected value describes the long-run average across many repetitions, not a prediction for any single play.
Casinos, lotteries, and raffles are businesses — they're only sustainable if the expected value for the player is negative (equivalently, positive for the house). This is a structural feature, not a secret: the "house edge" in any casino game is precisely the negative expected value built into the game's payout structure. Understanding this is exactly why expected value is taught as core numeracy for making informed decisions about gambling.
Using Expected Value to Compare Decisions
Problem: An insurer offers a policy. Based on historical data, there's a 2% chance of a $50,000 claim in a given year, and a 98% chance of no claim. What premium should the insurer charge to break even on average?
Expected claim cost = (0.02)(50,000) + (0.98)(0) = $1,000
Charging exactly $1,000 would make the insurer break even on average across many policyholders — in practice, insurers charge more than this expected value to cover administrative costs, profit margin, and the risk of unusually bad years, but the expected value is the essential starting point for any actuarial pricing calculation.
Expected Value for a Continuous Random Variable
For continuous variables (like a normally distributed measurement), expected value generalizes to an integral rather than a sum, but the underlying idea is identical: a probability-weighted average across all possible values. For a normal distribution specifically, the expected value is simply the mean, μ — which is exactly why μ is called the distribution's "expected value" as well as its mean in more advanced treatments.
Properties of Expected Value
Expected value has convenient mathematical properties that make it useful for building more complex calculations: it's linear, meaning E(aX + b) = aE(X) + b for constants a and b, and the expected value of a sum of random variables equals the sum of their individual expected values, E(X+Y) = E(X)+E(Y), even when X and Y aren't independent. This linearity is what makes expected value calculations tractable for complicated combined scenarios — you can often break a complex situation into simpler pieces, find each piece's expected value, and add them together.
Expected Value Isn't the Same as "Most Likely Outcome"
For the raffle example, the "most likely outcome" for any individual ticket is losing $2 (99.9% probability) — yet the expected value (−$1) is a different number entirely, because it accounts for the rare but large winning outcome too. Expected value is a genuinely different concept from the mode of the outcome distribution, and conflating the two is a common source of confusion — expected value describes a long-run average, not the single most probable individual result.
Real-World Uses
Insurance and actuarial science: essentially the entire pricing model of the insurance industry is built on calculating expected claim costs across large pools of policyholders, exactly as shown above.
Investment decisions: comparing the expected return of different investment options — weighing potential gains and losses by their probabilities — is standard practice in finance, though real investment decisions also weigh risk (variance) alongside expected value, not expected value alone.
Business decision-making: choosing between business strategies with uncertain outcomes (launch a new product or not, enter a new market or not) often uses expected value calculations to compare the average payoff of each option under uncertainty.
Game design: game designers calculate the expected value of in-game purchases, loot boxes, and betting mechanics explicitly, to ensure a game remains profitable while feeling fair enough to players.
Common Mistakes
The gambler's fallacy meets expected value. Believing that because a game has negative expected value in general, a specific "hot streak" or pattern of recent results changes the underlying probabilities is a well-documented cognitive error — for independent events (like most casino games), each play's expected value is unaffected by any previous outcome, however unlikely it feels intuitively.
Forgetting to account for the cost of playing. As the raffle example shows, expected value calculations for a wager must subtract the cost of participating, not just weight the possible prizes — omitting the entry cost is a common error that makes a genuinely unfavourable game look neutral or favourable.
Ignoring variance entirely. Two options can have identical expected values while carrying very different levels of risk — a guaranteed $500 and a 50/50 chance of $1,000 or $0 share the same $500 expected value but represent very different risk profiles. Expected value alone is an incomplete basis for a real decision when risk tolerance matters, which is most of the time in genuinely consequential decisions.
Expected Value and Variance Together
Because expected value alone ignores spread, it's almost always reported alongside a measure of variability — the variance or standard deviation of the outcome distribution. Variance itself is defined using expected value: Var(X) = E[(X−E(X))²], the expected squared deviation from the mean — meaning the very concept of spread that standard deviation measures is built directly on top of expected value. A decision-maker weighing two options with similar expected value but different variance is, in effect, choosing based on risk tolerance once the expected-value comparison alone doesn't settle the question.
A Second Worked Example: Comparing Two Business Strategies
Problem: A company can launch Product A (70% chance of $200,000 profit, 30% chance of $50,000 loss) or Product B (a guaranteed $120,000 profit). Which has the higher expected value?
E(Product A) = (0.7)(200,000) + (0.3)(−50,000) = 140,000 − 15,000 = $125,000
E(Product B) = $120,000 (guaranteed, so its own expected value)
Product A has a marginally higher expected value ($125,000 vs $120,000), but a risk-averse company might still prefer Product B's certainty, especially if a $50,000 loss would be seriously damaging — exactly the kind of trade-off between expected value and risk tolerance that pure expected-value comparison can inform, but not fully resolve on its own.
Can expected value be a number that's not even a possible outcome?
What does a "fair game" mean in terms of expected value?
Should I always choose the option with the highest expected value?
Share this article
Written by
Statistics Fundamentals Editorial Team
Written and reviewed by our team of statistics educators. Content is aligned with GCSE, A-Level, AP Statistics, and undergraduate curricula.
About Statistics Fundamentals →