A z-score answers one deceptively simple question: how unusual is this value, really? A test score of 82 sounds good in isolation — but is it unusual? Impressive? Average? Without knowing the mean and spread of everyone else's scores, a raw number like 82 tells you almost nothing. The z-score fixes this by converting any raw value into a single, universally comparable unit: standard deviations from the mean.
- How to calculate a z-score, and what the number actually means
- Why z-scores let you compare values from completely different scales
- How z-scores connect to percentiles and the standard normal table
- The difference between a z-score using population vs. sample parameters
This single idea — standardizing a raw value against a distribution's own mean and spread — turns out to be one of the most-reused building blocks in all of statistics. It's the mechanism behind percentiles, the basis for flagging outliers, the foundation of how standardized tests are scored fairly across different test versions, and the first step in nearly every hypothesis test you'll ever run.
The Formula
Subtract the mean (μ) from your raw value (x), then divide by the standard deviation (σ). The result is a pure number with no units — it tells you exactly how many standard deviations x sits above (positive z) or below (negative z) the mean. A z-score of 0 means the value equals the mean exactly. A z-score of +2 means the value sits two standard deviations above the mean; −1.5 means one and a half standard deviations below.
Why This Makes Values Comparable
Suppose a student scores 82 on a maths test (class mean 70, SD 8) and 68 on an English essay (class mean 60, SD 5). Which performance was actually stronger, relative to their classmates?
Maths z-score: z = (82 − 70) / 8 = 12/8 = 1.5
English z-score: z = (68 − 60) / 5 = 8/5 = 1.6
Despite the lower raw score, the English result is very slightly more impressive relative to the rest of the class — it sits marginally further above its own mean, in units of that subject's own spread. Raw scores alone couldn't tell you this, because the two tests have completely different scales and different amounts of natural variation. The z-score strips that away and puts both results on the same universal scale.
Z-Scores and the Standard Normal Distribution
When the underlying data is (at least approximately) normally distributed, converting to a z-score does something else useful: it maps your value directly onto the standard normal distribution — a normal distribution with mean 0 and standard deviation 1, for which the exact area under the curve (i.e., the exact probability of landing below any given point) has been calculated and tabulated for over a century.
This is precisely how a z-score converts to a percentile. A z-score of 1.5 corresponds to roughly the 93rd percentile — meaning about 93% of a normally distributed population falls below that value. A z-score of 0 always corresponds to the 50th percentile (the mean is, by definition, the halfway point of a symmetric normal distribution).
The familiar 68-95-99.7 empirical rule is really a statement about z-scores: about 68% of values fall between z = −1 and z = +1; about 95% fall between z = −2 and z = +2; about 99.7% fall between z = −3 and z = +3. A z-score beyond ±3 is genuinely rare in a normal distribution — under 0.3% of values fall out there.
Worked Example
Problem: Adult male height in a population is normally distributed with mean μ = 175cm and standard deviation σ = 7cm. What is the z-score for someone 189cm tall, and roughly what percentile does that correspond to?
Z-score: z = (189 − 175) / 7 = 14/7 = 2.0
Percentile: a z-score of 2.0 corresponds to approximately the 97.7th percentile — this person is taller than roughly 97.7% of the population, and by the empirical rule, a z-score of exactly 2 marks the upper edge of the "middle 95%" of the distribution.
Working Backward: From Z-Score to Raw Value
The formula rearranges easily to go the other direction — useful when you know a target percentile and want the corresponding raw value:
If a company wants to identify the top 5% of sales performance, and monthly sales are normally distributed with μ = $40,000 and σ = $6,000, the z-score corresponding to the 95th percentile is approximately 1.645. So the threshold is x = 40,000 + 1.645(6,000) = 40,000 + 9,870 = $49,870 — anyone selling above roughly $49,870/month is in the top 5%.
Population vs. Sample Z-Scores
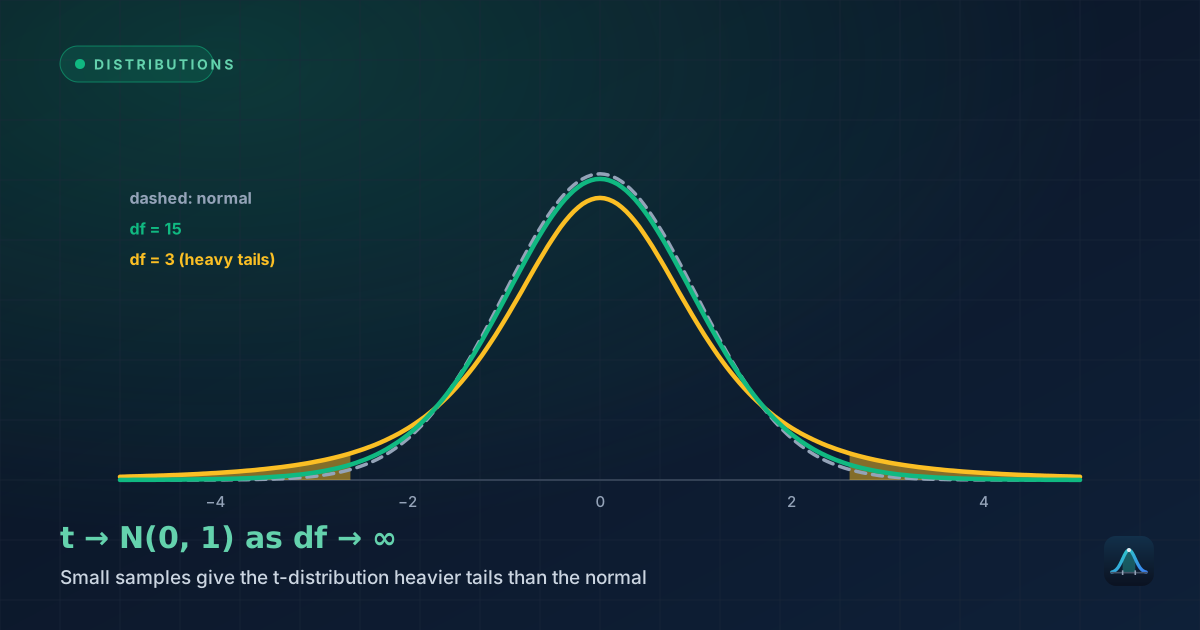
The formula z = (x − μ)/σ technically uses the population mean and population standard deviation. In practice, these true population parameters are often unknown, and a sample mean (x̄) and sample standard deviation (s) are used as estimates instead. When this substitution happens with a small sample, the extra uncertainty introduced means a t-score (from the t-distribution, which has heavier tails) is technically more appropriate than a z-score — see our guide to the t-distribution vs. normal distribution for when each is used.
Z-Scores as an Outlier Detection Method
Because z-scores standardize distance from the mean, they double as a simple outlier-flagging rule: values with |z| > 3 are commonly flagged as potential outliers, since under a normal distribution fewer than 0.3% of values should naturally fall that far out. This is a useful complement to the IQR-based 1.5×IQR rule — the z-score method assumes the data is roughly normal, while the IQR method makes no such assumption, which is why the IQR method is generally preferred for skewed data.
Real-World Uses of Z-Scores
Standardized testing: the SAT, GRE, and many national exams scale raw scores using z-scores (then transform them onto a more familiar reporting scale, like 200-800) specifically so that scores from different test administrations — which can vary slightly in difficulty — remain comparable. A 700 on one sitting and a 700 on another sitting are calibrated to represent the same relative performance, not necessarily the same raw number of correct answers.
Growth charts in medicine: a paediatrician assessing a child's height or weight uses a z-score against age-matched population norms, not the raw measurement, because "60cm tall" means something completely different for a newborn than for a five-year-old. A z-score lets a single number communicate "how this child compares to others their age" regardless of the age-specific scale.
Finance: the Altman Z-score is a well-known application outside pure statistics — a weighted combination of financial ratios used to estimate a company's bankruptcy risk, built on the same underlying idea of standardizing a raw measurement against a reference distribution to judge how unusual it is.
Quality control: manufacturing processes often use z-scores to flag individual measurements that fall suspiciously far from a process's established mean and standard deviation, well before a formal statistical process control chart signals a systematic problem.
Common Mistakes
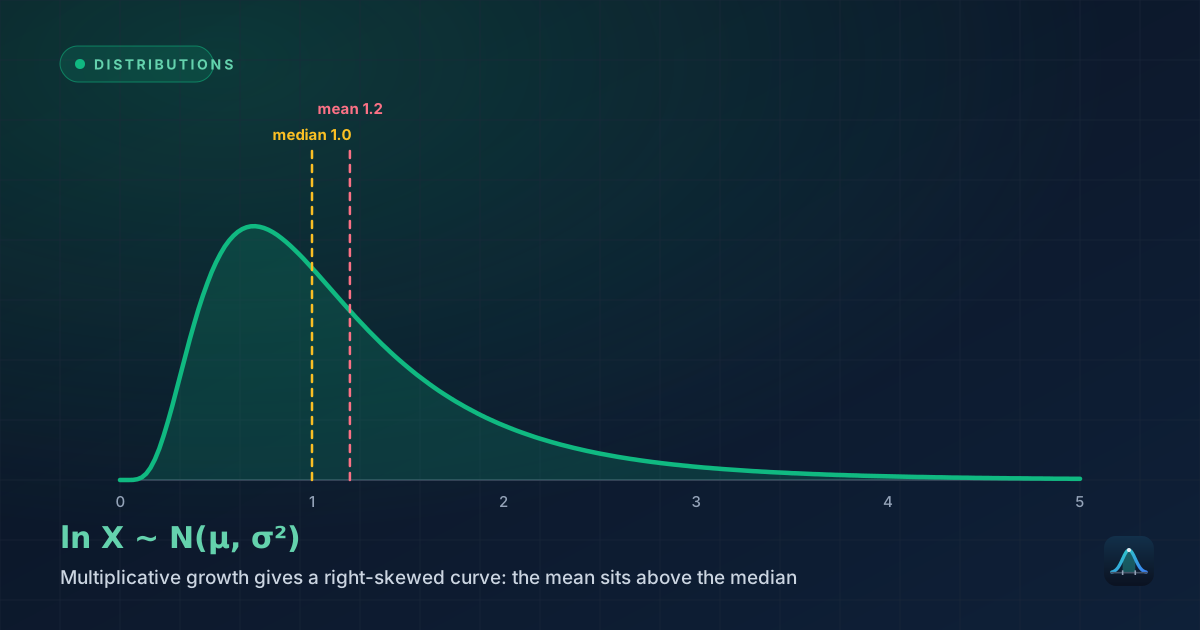
Applying the normal-table percentile to non-normal data. The z-score arithmetic always works, but reading off a percentile from the standard normal table silently assumes the underlying population is approximately normal. For strongly skewed data — income, reaction times with a long tail, most real-world "waiting time" data — the percentile you read off will be wrong, sometimes substantially.
Confusing a z-score with a raw difference. A z-score of 2 doesn't mean "twice as much" of anything — it means "two standard deviations from the mean." Two data sets can have the same raw difference from their respective means but very different z-scores if their standard deviations differ, and this is exactly the point of standardizing in the first place.
Using population formulas with sample data without checking sample size. When σ (the true population standard deviation) is unknown and estimated from a small sample, the resulting z-score understates the real uncertainty. For small samples (typically n < 30) with an unknown population SD, a t-score from the t-distribution is the more defensible choice, precisely because it accounts for that extra uncertainty with wider tails.
Can a z-score be negative, and what does that mean?
Do z-scores only work for normally distributed data?
What's the difference between a z-score and a percentile?
Why is the standard normal distribution's mean always 0 and SD always 1?
Share this article
Written by
Statistics Fundamentals Editorial Team
Written and reviewed by our team of statistics educators. Content is aligned with GCSE, A-Level, AP Statistics, and undergraduate curricula.
About Statistics Fundamentals →