The t-test, Pearson correlation, and ANOVA covered elsewhere on this site are all parametric tests — they assume the underlying data follows a specific distribution (usually approximately normal) and make inferences about that distribution's parameters, like its mean. When that assumption doesn't hold — the data is heavily skewed, contains extreme outliers, is only ordinal (ranked categories rather than genuine numbers), or the sample is simply too small to trust normality — a non-parametric test offers a more robust alternative that makes far fewer assumptions about the data's shape.
- What makes a test "non-parametric," and why ranks are the key idea
- The Mann-Whitney U test as the non-parametric counterpart to the two-sample t-test
- A full worked example, computed by hand using ranks
- A guide to which non-parametric test replaces which parametric one
The Core Idea: Ranks Instead of Raw Values
Most non-parametric tests share a common trick: instead of working with the actual numeric values (which is where distributional assumptions like normality come in), they convert the data to ranks — 1st smallest, 2nd smallest, 3rd smallest, and so on — and test whether those ranks are distributed the way they'd be expected to be under the null hypothesis. Because rank order survives even when the underlying data is badly skewed or contaminated by a wild outlier, tests built on ranks are far less sensitive to violations that would seriously distort a mean-based test like the t-test.
The Mann-Whitney U Test
The Mann-Whitney U test (also called the Wilcoxon rank-sum test) is the non-parametric counterpart to the independent two-sample t-test. Instead of comparing the two groups' means, it tests whether one group's values tend to rank higher than the other's — a genuinely different, more general question that doesn't require either group's data to be normally distributed.
Worked Example: Comparing Two Customer Service Approaches
Problem: A company tests two approaches to customer service and records satisfaction scores (on a 1-12 scale) from 5 customers under each approach. Approach A: 3, 5, 2, 8, 6. Approach B: 7, 9, 4, 10, 11. Is there a significant difference between the two approaches?
Step 1: Combine and rank all 10 values together, from smallest to largest, regardless of which group they came from:
| Value | 2 | 3 | 4 | 5 | 6 | 7 | 8 | 9 | 10 | 11 |
|---|---|---|---|---|---|---|---|---|---|---|
| Rank | 1 | 2 | 3 | 4 | 5 | 6 | 7 | 8 | 9 | 10 |
| Group | A | A | B | A | A | B | A | B | B | B |
Step 2: Sum the ranks within each group. Group A's values (3, 5, 2, 8, 6) have ranks (2, 4, 1, 7, 5) — sum = 19. Group B's values (7, 9, 4, 10, 11) have ranks (6, 8, 3, 9, 10) — sum = 36.
Step 3: Calculate U for each group.
U₁ (for Group A) = 19 − 5(6)/2 = 19 − 15 = 4
U₂ (for Group B) = n₁n₂ − U₁ = 25 − 4 = 21
The test statistic is the smaller of the two, U = 4. As a sanity check, U₁ + U₂ should always equal n₁ × n₂ (here, 4 + 21 = 25 = 5×5) — a useful arithmetic check before moving on.
Step 4: Compare to a critical value or compute a p-value. For this small a sample, an exact p-value comes from the Mann-Whitney sampling distribution rather than an approximation — for U=4 with n₁=n₂=5, the exact two-tailed p-value works out to p ≈ 0.095. At the conventional α=0.05 threshold, this result does not reach statistical significance — despite Group B's scores visibly looking higher throughout the table above, a sample of only 5 per group isn't quite enough to rule out chance as the explanation at the standard significance level.
Notice what the U statistic is really capturing: a small U (like 4, well below the maximum possible 25) indicates the two groups' values are cleanly separated by rank, with Group A's values tending to occupy the lower ranks and Group B's the higher ones — exactly the pattern visible in the ranked table above.
A Quick Guide to Non-Parametric Alternatives
| Parametric test | Non-parametric alternative |
|---|---|
| Independent two-sample t-test | Mann-Whitney U test |
| Paired t-test | Wilcoxon signed-rank test |
| One-way ANOVA | Kruskal-Wallis test |
| Pearson correlation | Spearman's rank correlation |
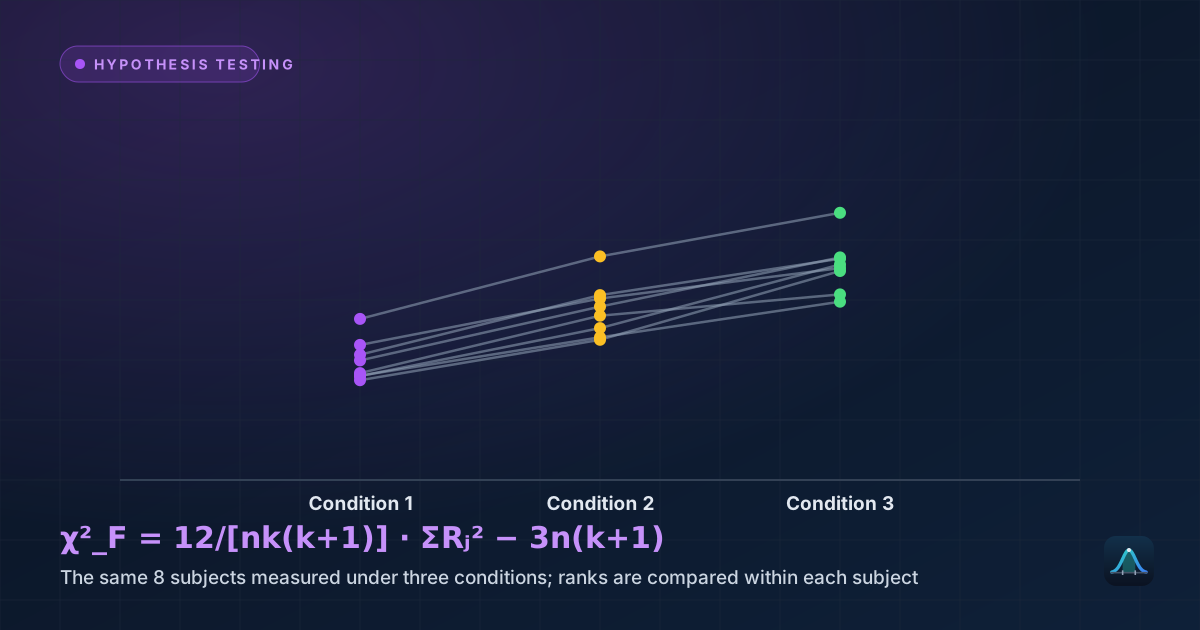
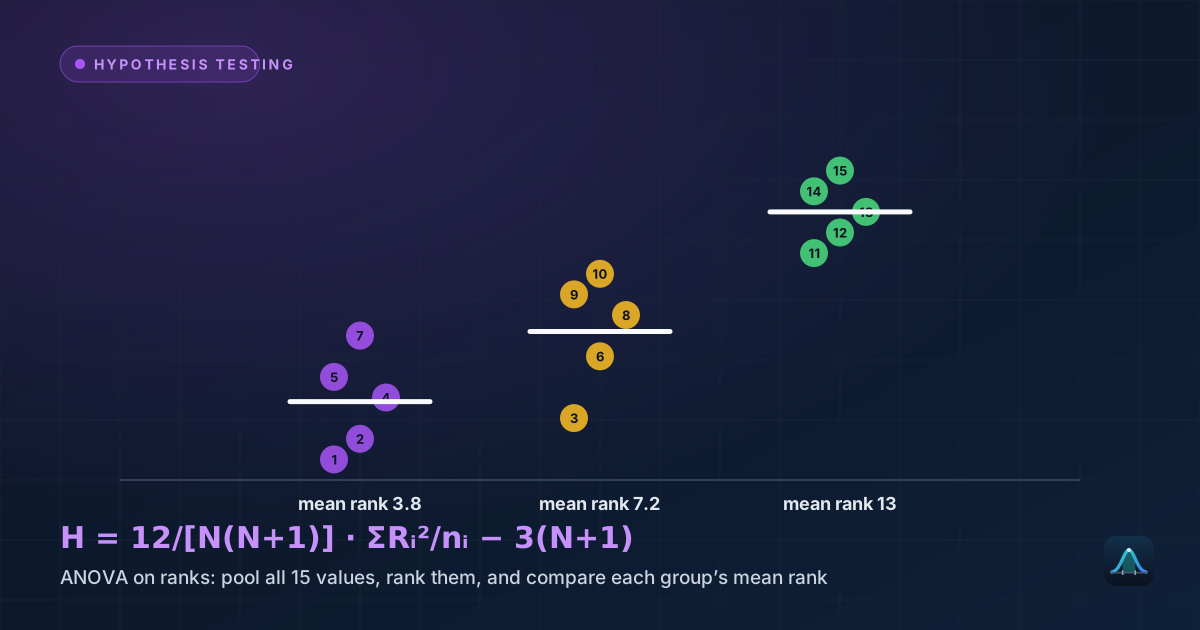
Each non-parametric alternative applies the same core idea — convert to ranks, then test the ranks — extended to match the structure of its parametric counterpart: the Wilcoxon signed-rank test ranks the paired differences instead of raw scores (mirroring the paired t-test's own logic of working with differences), the Kruskal-Wallis test extends the Mann-Whitney U logic to more than two groups (mirroring how ANOVA extends the two-sample t-test to more than two groups), and Spearman's correlation computes Pearson's correlation formula on the ranks of the data rather than the raw values, making it robust to outliers and able to capture any consistent monotonic (not just straight-line) relationship.
When to Reach for a Non-Parametric Test
Ordinal data: satisfaction ratings, rankings, or any scale where the categories have a clear order but the numeric gaps between them aren't necessarily equal (is the gap between "satisfied" and "very satisfied" really the same size as between "neutral" and "satisfied"?) is a natural fit for rank-based methods, since ranks don't assume equal spacing in the first place.
Small samples with visible non-normality. With a small sample, it's hard to even check normality reliably, and a parametric test's guarantees rest heavily on that assumption holding — a non-parametric test sidesteps the issue by not requiring it.
Data with extreme outliers. Because ranks compress extreme values down to "just the highest rank" rather than letting their raw magnitude dominate the calculation, non-parametric tests are considerably more resistant to a small number of extreme, possibly erroneous data points than mean-based tests are.
Common Mistakes
Assuming non-parametric tests are always "safer" and should be the default choice. When the parametric test's assumptions genuinely hold, the parametric version is more statistically powerful — more likely to correctly detect a real effect — so defaulting to non-parametric tests "just in case" sacrifices power unnecessarily when it isn't needed.
Interpreting the Mann-Whitney U test as a test of medians. A common simplification, but not strictly accurate — the test more precisely asks whether one group's values tend to be ranked higher than the other's overall, which is closely related to but not exactly the same claim as "the medians differ," especially when the two distributions have different shapes.
Do non-parametric tests require no assumptions at all?
Can a non-parametric test be used even when the parametric assumptions ARE met?
Why does the worked example's result feel surprising given how different the two groups look?
Is Spearman's correlation the same as Pearson's correlation applied to ranks?
Share this article
Written by
Statistics Fundamentals Editorial Team
Written and reviewed by our team of statistics educators. Content is aligned with GCSE, A-Level, AP Statistics, and undergraduate curricula.
About Statistics Fundamentals →