Some statistics come with tidy formulas for their standard error, such as the sample mean. Many do not: a correlation between ranks, a ratio of two averages, a trimmed mean, a standard deviation. The jackknife is a resampling method that estimates the bias and standard error of almost any statistic, using nothing more than the ability to recompute it. The idea is disarmingly simple: recompute the statistic n times, each time leaving out exactly one observation, and see how much the answer moves. It is the older, deterministic cousin of the bootstrap.
- How to compute leave-one-out estimates and the jackknife standard error
- How to estimate and remove bias, worked through by hand
- How the jackknife compares with the bootstrap
- Which statistics it handles badly
The Procedure
Given a sample of n observations and a statistic θ̂ computed from all of them:
- For each i from 1 to n, delete observation i and recompute the statistic on the remaining n − 1 values. Call the result θ̂₍ᵢ₎.
- Average these leave-one-out estimates to get θ̄.
- The jackknife standard error is √[ (n − 1) ÷ n × Σ(θ̂₍ᵢ₎ − θ̄)² ].
- The jackknife bias estimate is (n − 1)(θ̄ − θ̂), and the bias-corrected estimate is θ̂ minus that bias.
The factor (n − 1) ÷ n in the standard error may look odd. Leave-one-out estimates are all very similar, because each shares n − 1 observations with the full sample, so their raw spread is much smaller than the real sampling variability. The multiplier rescales it back up.
Worked Example
Problem: A sample of five measurements is 4, 7, 9, 12, and 18. The sample mean is 10. Use the jackknife to (a) find the standard error of the mean, and (b) estimate and correct the bias of the "divide by n" variance.
(a) Standard error of the mean
Delete each value in turn and average the other four:
| Value removed | 4 | 7 | 9 | 12 | 18 |
|---|---|---|---|---|---|
| Mean of the other four | 11.5 | 10.75 | 10.25 | 9.5 | 8.0 |
Their average is 10.0, and the squared deviations from it are 2.25, 0.5625, 0.0625, 0.25, and 4.0, totalling 7.125. Then SE = √(4/5 × 7.125) = √5.7 ≈ 2.387. That is exactly the textbook value s ÷ √n, since s² = 28.5 gives √(28.5 ÷ 5) = 2.387. For the mean, the jackknife reproduces the classical formula perfectly, which is a useful sanity check that the method is set up correctly (see standard error).
(b) Bias of the divide-by-n variance
The plain "divide by n" variance of the full sample is 114 ÷ 5 = 22.8, where 114 is the sum of squared deviations from the mean of 10. As shown in unbiased estimators and mean squared error, this estimator is biased downward. Recompute it on each leave-one-out sample of four values:
| Value removed | 4 | 7 | 9 | 12 | 18 |
|---|---|---|---|---|---|
| Variance (divide by 4) | 17.25 | 25.6875 | 28.1875 | 27.25 | 8.5 |
The average is 21.375. The jackknife bias estimate is (5 − 1)(21.375 − 22.8) = 4 × (−1.425) = −5.7, confirming that the estimator runs low. Subtracting the bias gives the corrected estimate 22.8 − (−5.7) = 28.5. That is precisely the sample variance s² that divides by n − 1, the correct unbiased estimator. The jackknife recovered Bessel's correction automatically, without being told about it. For this statistic, the correction is exact; for most other statistics it removes the main part of the bias rather than all of it.
A statistic with no simple formula: the standard deviation
Repeat the process for the sample standard deviation, which has no convenient standard error formula. The full-sample value is s = √28.5 ≈ 5.339. The five leave-one-out standard deviations (dividing by 3) are about 4.796, 5.852, 6.131, 6.028, and 3.367. Their jackknife standard error works out to about 2.10, so a standard deviation of 5.34 from just five points carries an uncertainty of roughly 2, nearly 40% of the estimate. The bias correction adjusts s up slightly to about 5.75, in line with the fact that s slightly underestimates σ on average.
Jackknife vs. Bootstrap
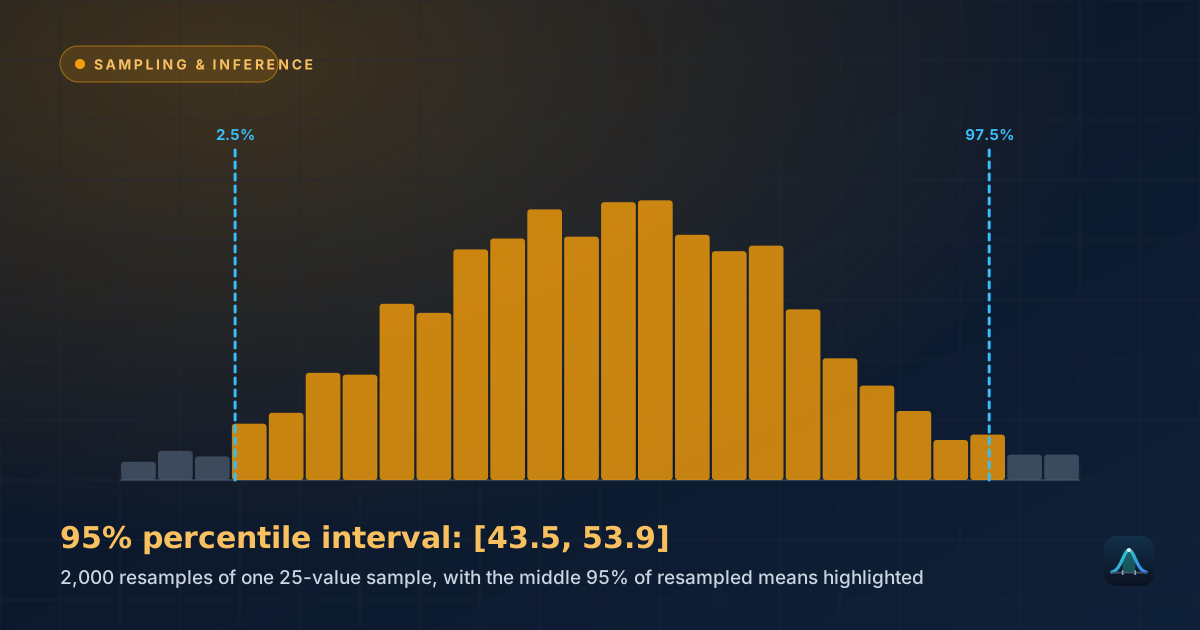
Both methods recompute a statistic on modified versions of the data. The jackknife uses exactly n fixed subsamples, so it is deterministic: run it twice and get the same answer, and it is cheap when n is small. The bootstrap draws thousands of random resamples with replacement, which needs a computer but handles a wider range of statistics and can produce confidence intervals directly from percentiles. In modern practice the bootstrap has largely taken over, but the jackknife remains valuable when computation is expensive, when a deterministic answer is needed, and for estimating bias. It also underlies influence diagnostics: how far the estimate moves when one point is removed is the same idea behind Cook's distance.
The closely related technique of leave-one-out cross-validation, the extreme case of k-fold cross-validation with k = n, uses the same deletion pattern, but to measure a model's prediction error rather than a statistic's standard error.
Where the Jackknife Fails
The method assumes the statistic changes smoothly when one observation is removed. It works well for means, variances, correlations, regression coefficients, and ratios. It works badly for non-smooth statistics such as the median or other quantiles. In the example, removing each of the five values changes the median only to 10.5, 10.5, 9.5, 8, or 8: a handful of repeated jumps that do not capture how the median would really vary. The jackknife standard error of the median is known to be inconsistent, meaning it does not settle on the right answer even as the sample grows. The bootstrap is preferred for such statistics.
Real-World Uses
Survey statistics: agencies use jackknife-type replication to estimate variances for complex statistics computed from complicated survey designs.
Ecology and biology: the jackknife is a traditional tool for bias-correcting species-richness and diversity estimates, where formulas are hard to derive.
Model validation: repeated leave-one-out evaluation checks how stable a fitted model or estimate is to the removal of any single data point.
Common Mistakes
Forgetting the (n − 1) ÷ n multiplier. Without it, the standard error comes out far too small, since leave-one-out estimates cluster tightly.
Using it for the median or other quantiles. The results look plausible but are unreliable. Use the bootstrap for those.
Expecting complete bias removal. The correction removes the leading term of the bias, which is exact only for some statistics like the variance above.
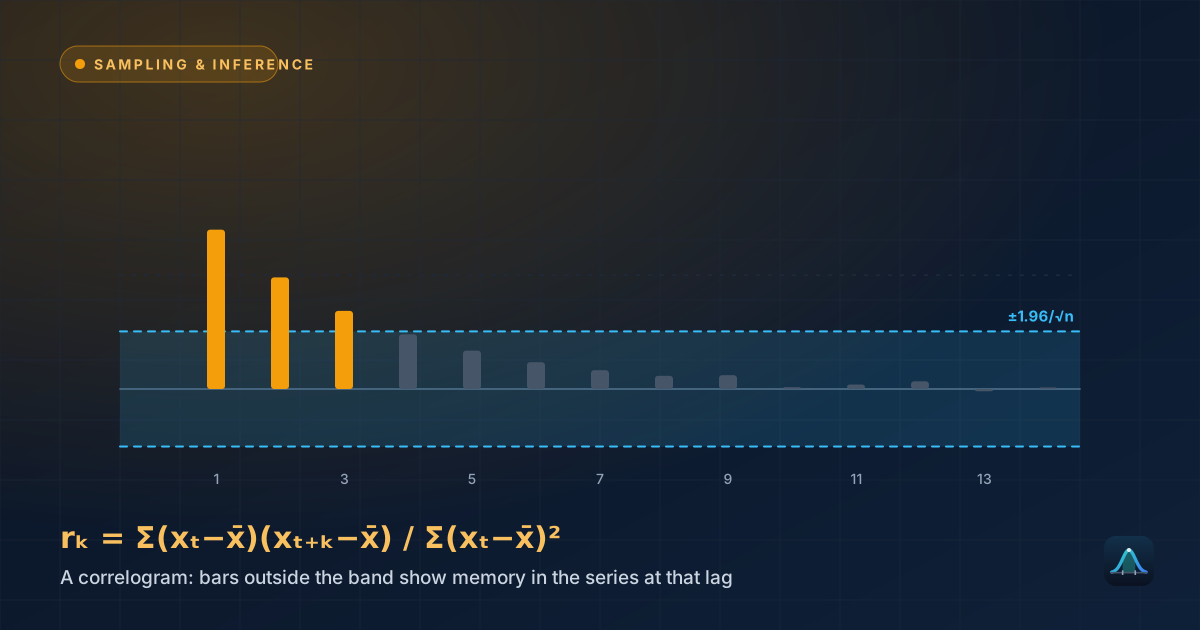
Ignoring dependence between observations. Leaving out one observation assumes observations are independent. For clustered or time-ordered data, whole clusters or blocks need to be deleted instead.
Why is it called the jackknife?
How many computations does it need?
What are pseudo-values?
Can it produce confidence intervals?
Share this article
Written by
Statistics Fundamentals Editorial Team
Written and reviewed by our team of statistics educators. Content is aligned with GCSE, A-Level, AP Statistics, and undergraduate curricula.
About Statistics Fundamentals →